


- Explore Laptops 2-in-1 Laptops Business Laptops Gaming Laptops Student Laptops View All Laptops
-
By BrandYoga ThinkPad IdeaPad Legion Lenovo
-
ResourcesTrade-In Program Financing Options My Lenovo Rewards
-
Espot Path:
/espotdirctory/us-public-laptops-espot

Outlet
skip to main content
-
 Accessibility
 -
Contact Us
Sales:
Order Support:
-
Rewards
-
Account
-
Cart
-
Discover the latest PCs at Lenovo.com >
|
-
LenovoPRO Small Business Store
|
-
Accessibility
-
Contact
Help placing an order
Business order help
Existing order help
-
Rewards
-
Account
-
Cart
-
LenovoPRO Small Business Store
|
-
Accessibility
-
Locator
-
Contact Us
Help placing an order
Business order help
Existing order help
-
Rewards
-
Account
-
Cart
-
LenovoPRO Small Business Store
|
-
Accessibility
-
Contact
Help placing an order
Business order help
Existing order help
-
Rewards
-
Account
-
Cart
-
LenovoPRO Small Business Store
|
-
Accessibility
-
Contact
Help placing an order
Business order help
Existing order help
-
Rewards
-
Account
-
Cart


What is data analytics?
Data analytics is the process of examining large datasets to find hidden patterns, correlations, and insights. Simply put, it's the science of transforming raw data into actionable insights. It takes the mountains of numbers, statistics, and facts available to business. Then, it turns them into usable information that companies can act on.
Data analytics empowers businesses to make data-driven decisions. When analyzing historical data, companies can spot trends. They can predict future outcomes and optimize their strategies. For example, retailers can use data analytics to understand customer purchasing habits. One store might forecast demand to be ready for a surge, while another may tailor promotions to the current season.
The goal of data analytics is to provide actionable intelligence. With the right analytics, businesses gain a competitive edge.
What are the key components of data analytics?
Data analytics boils down to a step-by-step process designed to transform raw data into business intelligence.
The 4 key phases of data analytics:
- Collection
- Data Preparation
- Analysis
- Interpretation
Let’s look at these phases or components of data analysis in greater detail.
- Collection: The first requirement is data - and lots of it! Data can come from many sources. These are both internal (sales data, CRM systems, web analytics) and external (industry reports, economic indicators). The more data there is to work with, the more accurate the analytics can be.
- Data Preparation: Cleaning and organizing the data to eliminate inconsistencies, errors and duplication that could skew analysis.
- Analysis: Next is the actual analysis. This is where the raw data is processed and manipulated using various statistical methods and analytical techniques. The aim is to find meaningful patterns and relationships between variables and anomalies. Tools like machine learning algorithms are commonly used here.
Note that there are both exploratory and advanced analyses. The former is a simple visual inspection of the data before diving into modeling (predictive analytics, simulations, regression analysis, etc.) The latter refers to more complex statistical analyses and machine learning techniques to uncover deeper insights. These techniques include clustering, classification, neural networks, and more.
- Interpretation: The last component is deriving insights from the analysis. One must interpret what the data is saying and determine the implications for a business. The insights reveal a new market opportunity or uncover inefficiencies in the operations.
How does big data analytics differ from traditional data analytics?
Traditional data analytics deals with structured, small-scale data — a few numbers that fit neatly into relational databases. For instance, it wouldn't be too hard to accomplish with organized spreadsheets and tables. The datasets are measured in megabytes or gigabytes. Analytics primarily focuses on historical data to inform current decisions.
Meanwhile, big data deals with unstructured and semi-structured data pouring in from websites, mobile devices, sensors, and social platforms. Plus, the data tackled is often recorded in real-time. As such, Big Data does not follow a predefined data model. It requires advanced tools and technologies to efficiently process it.
What is the first step of the data analytics process?
This brings us to a great point - effective data analytics always starts by identifying business needs, questions or problems that require insights. Clarifying the goal upfront keeps the project focused and impactful.
The organization needs help forecasting next quarter's sales pipeline based on market conditions. Or predicting which customers are most likely to churn. Or pinpointing strengths and weaknesses across product lines.
This planning phase also involves identifying what data will be needed to achieve the objective. That includes relevant data sources and methods of data collection. For example, to reduce churn, a business may need data on customer transactions, behaviors, and feedback. Identifying goals and needs might seem tedious, but it prevents wasting resources exploring dead-ends.
Can you outline the typical stages of the data analytics process?
The data analytics process can be broken down in stages.
The 5 main stages of the data analytics process:
- Discovery
- Data Preparation
- Model Planning
- Model Building
- Communicating Results
Let us look at these five stages in greater detail.
- Discovery: This stage involves several departments in an organization. Often it can even come from strategic planning goals. Take the time to identify the goal and gathering methods.
- Data Preparation: This stage is about getting data analytics ready. It includes collecting data from various sources, cleaning it, and transforming it into a suitable format. Data quality issues like duplicate or inaccurate data are removed. The rest of the data is consolidated into a single, integrated view.
- Model Planning: Model planning determines the methods and techniques to use for analysis. Some examples include statistical models, data mining algorithms and machine learning. The best method to choose is one that is in line with the end goal.
- Model Building: This is where the actual analysis happens. The prepared data is processed using the methods selected. Analytical models are built iteratively, with assessment and refining at each step.
- Communicate: Results: Finally, the analytical findings are interpreted, and insight is shared with stakeholders. Data visualization makes the insights easy to understand and act on. The key is telling a compelling story with the data that drives business impact.
What is big data? How does it relate to analytics?
Big data refers to extremely large, diverse sets of data that grow fast and come in various formats. It's data that's too big and complex for traditional data processing tools to handle. Some key traits of big data are the "3 V's" - high volume, velocity, and variety. Here are some examples of big data that fit these traits:
- Social media data with thousands of posts and likes
- IoT (Internet of Things) sensor data from smart homes or wearables
- Financial data from banking transactions to prevent fraud
Big data analytics then focuses on cost-effectively extracting impactful insights from those diverse data assets. Due to the sheer amount of data points and the complexity of the relationship between them, big data analytics relies on innovative techniques like machine learning algorithms, predictive analytics, data mining, AI (Artificial Intelligence) and more. These techniques use powerful computing to complete analysis.
So, what does this have to do with analytics? Well, hidden within big data is valuable insight waiting to be discovered. And organizations need analytics to make sense of it. They apply analytical techniques specifically designed for big data, such as cluster analysis, regression analysis and cohort analysis.
How does big data contribute to the field of data analytics?
Big data has been a game changer for data analytics. It has vastly expanded the possibilities of what can be analyzed and the depth of insights that can be uncovered.
5 notable contributions big data has contributed to the field of data analytics:
- More Statistical Power for Models: Thanks to the ever-growing data volume, more data points mean more statistical power for models to spot subtle patterns.
- Unprecedented Variety: New unstructured data expands analytical frontiers into text, video, etc.
- Real-time insights: Streaming data is analyzed at lightning speed, enabling real-time insights.
- Sparking Innovation: Big data needs constant invention of smarter algorithms and approaches.
- Hyper-customized personalization: These huge datasets include granular details.
What is a model in data analytics?
In data analytics, a model is a mathematical representation designed to help explain or forecast the behavior of some real-world phenomenon. Models quantify relationships between variables that have been observed historically through data analysis.
Once created, models can predict outcomes given different inputs. For example, predictive models can estimate future sales figures based on past sales data and marketing drivers. Another example is a clustering model used for customer segmentation. It groups customers with similar characteristics or behaviors together.
How are models used in the context of big data analytics?
Models provide a structured way to extract insights and make decisions from these massive datasets. With big data, models can be trained on much larger and diverse datasets, leading to more accurate insights.
The 6 common ways to use Big Data analytics models:
- Predictive modeling forecasts metrics like customer churn risk, inventory needs, or credit defaults.
- Classification algorithms group individuals or events by common data patterns.
- Anomaly detection identifies deviations from standard data patterns.
- Sentiment analysis classifies emotions within text data.
- Recommendation engines suggest content users may like.
- Simulation models assess "what-if" scenarios.
What is the relationship between big data and data analytics?
Big data and data analytics are intricately linked. Big data provides the raw material - huge, diverse, and fast-growing datasets. Data analytics provides the means to extract value from that raw material. It is the process of examining big data to uncover hidden patterns, unknown correlations, and valuable insights.
The expansion of big data (driven by technologies like IoT, mobile, social media) has necessitated more real-time, scalable analytics capabilities. And expanding analytics capacities like cloud computing have enabled organizations to extract maximum value from ever-growing data assets.
You can think of big data as input and data analytics as the transformation process that turns it into an output of actionable intelligence. Big data on its own is just a massive collection of data points. Analytics is needed to make sense of it and derive meaningful knowledge.
How do organizations leverage both big data and data analytics for insights?
Forward-thinking organizations use both big data and data analytics in tandem to make smarter decisions. They recognize that the real value lies in a combination of both. The approach usually involves a few key steps.
First, they put in place the proper infrastructure to collect and store large volumes of data from diverse sources. This could include data lakes or cloud-based big data platforms. The goal is to create a centralized repository that analytics tools can easily access.
Next, they apply big data analytics techniques to explore the data and surface insights. Here is where data scientists and analysts come in the picture. They use tools like data mining, statistical modeling, and machine learning, looking for things that traditional methods would overlook.
Finally, they use data visualization to translate the analytical findings into easy-to-understand reports and dashboards. This allows decision-makers across the organization to leverage data-driven insights in their day-to-day work.
How are data and analytics interconnected in decision-making processes?
Data-driven decisions offer significant advantages, such as reduced bias, increased consistency, superior monitoring, and stronger stakeholder alignment.
With big data, this interconnection becomes even more potent. The granular, real-time nature of big data means analytics can surface insights faster and decisions can be more responsive. Think of real-time pricing decisions based on big data analytics of supply and demand signals. Data and analytics have become the engines that powers agile decision-making.


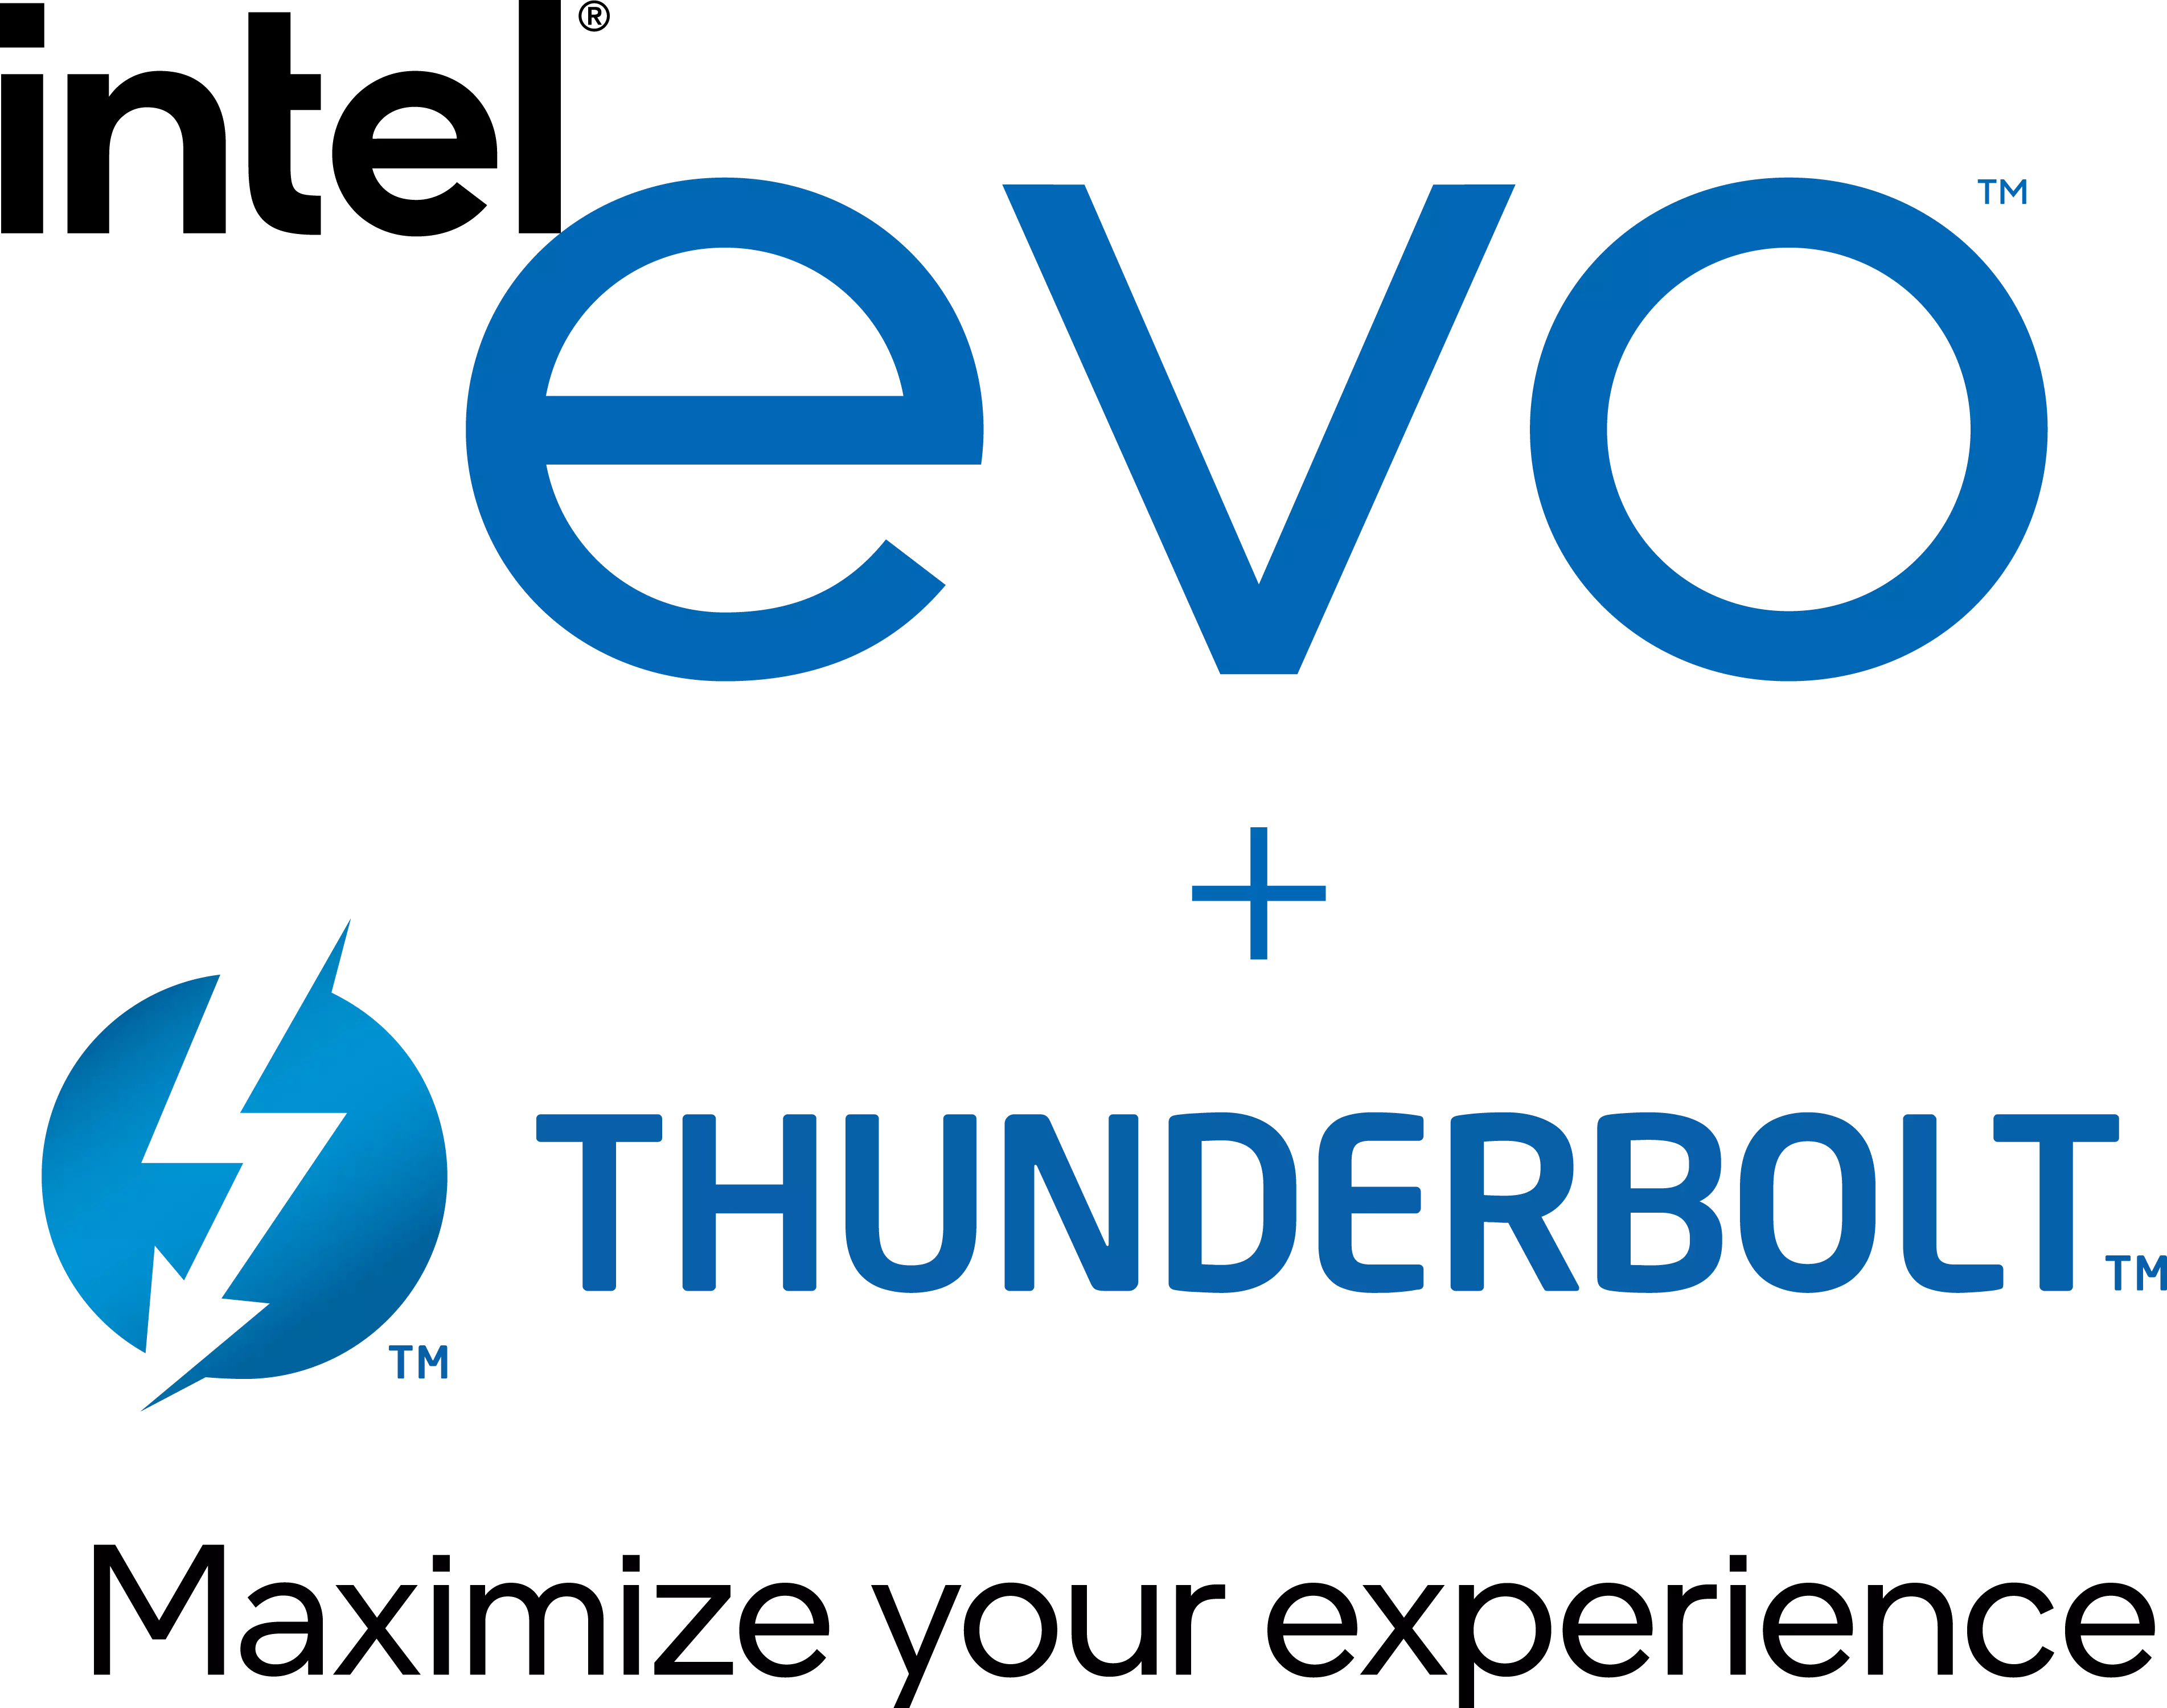
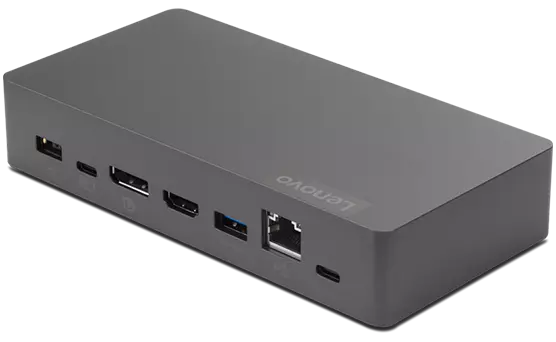
Maximize your Intel® Evo™ laptop experience with Thunderbolt™ accessories from Lenovo


Distributed servers like Hadoop clusters enable parallel big data processing for faster insights. Cloud servers readily scale to handle fluctuating workloads and fast hardware accelerates machine learning.
First, assess your data volume, velocity, and variety. Then, optimize CPU cores, memory, and storage to match workloads. GPU (Graphics Processing Units) and networking speed also matter.
The main challenge is poor data quality making analysis unreliable. There are also technical complexities that arise from integrating different data sources, which often result from a lack of skilled analysts. Finally, data storage needs and high-security risks are challenges as well.
That depends on the industry it is being used in, but it usually revolves around things like customer behavior analysis, fraud detection, predictive maintenance, and supply chain optimization. In healthcare, it is used to improve patient outcomes and reduce costs. In finance, it helps detect fraudulent transactions.
The skills to learn for a career in big data are statistical analysis, machine learning, SQL/Python programming, visualization to present insights, and communicating analytical findings clearly to guide business decisions.
Affordable cloud-based tools now allow small companies to leverage analytics for optimizing marketing, customer experiences, operational efficiency—things once only possible for large enterprises.
Ethical concerns around big data are plentiful. Companies must ensure strong privacy protections and security controls and eliminate bias in data collection and analysis. Transparency on data usage and consent is also important. Finally, always evaluate the potential of unintended consequences of analytics-based decisions.
Expect continued fast growth as data volumes expand. Advances in AI and machine learning will automate more analytics tasks and make predictions more accurate.
Big data provides the vast training data sets machine learning algorithms need. Meanwhile, analytics uses machine learning techniques to uncover patterns. AI technologies like deep learning can now analyze complex unstructured data.
Both involve data analysis. However, Business intelligence looks at past performance through descriptive statistics on structured data. Big data analytics focuses more on predicting future outcomes by applying advanced modeling techniques to unstructured and semi-structured datasets.
Data visualization takes complex analytical findings and big data outputs and transforms them into charts, graphs, and dashboards. These are easy for business leaders to digest. Visualization allows decision-makers to grasp insights and trends quickly without statistical knowledge. It facilitates data-driven decision-making.
The process starts by establishing formal data governance standards upfront that define policies, data formatting rules, lineage tracking, etc. Then, they must assign cross-functional data responsibilities. Profiling data regularly helps to identify and fix quality issues.
The Lenovo Advantage
There are so many ways you can save a bundle at Lenovo with regular deals on new laptops, desktops, tablets and electronic devices. Plus, take advantage of our price match guarantee and financing options, or additional savings with exclusive Lenovo coupons.
If you’re a small business owner, you can take advantage of additional business benefits and savings by signing up for a free Lenovo Pro membership.
If you’re a student, teacher, healthcare worker, military member or senior, verify safely through ID.me to validate your eligibility for additional discounts when you buy.
Don’t forget to sign up to My Lenovo Rewards and Smart Family before you buy to earn rewards that can be applied to future purchases.
And at Lenovo, we also have a special trade-in program for users of outdated laptops, computers and other electronics looking to trade up into a modern device.
And for businesses, students and gamers, join one our free Lenovo online communities for SMB, education or gaming. Get connected with your peers, stay engaged, learn and share.
Don’t miss all these opportunities to save plus free shipping on all products.
Enter Email to receive valuable updates
Select Country / Region:

Please select a Country / Region